Intergenerational Extraction in Liberal Democracies Link to heading
Executive summary Link to heading
The strongest version of the thesis is not that liberal democracy automatically becomes generational warfare. The evidence is better read as a conditional claim: when an aging electorate, pay-as-you-go welfare finance, low fertility, high age-skewed turnout, and asset-protecting political coalitions interact, policy can become systematically biased toward present voters and against younger and future cohorts. In that setting, today’s electorate can consume more than it contemporaneously funds, while pushing adjustment onto lower-turnout younger workers or people not yet born through payroll taxes, debt rollover, inflated housing costs, and slower reform. \[1\]
The cross-country evidence is consistent with that conditional thesis. In the OECD, all member countries except Israel were below replacement fertility in 2024, and the OECD reports that 18–24 year-olds vote, on average, 12 percentage points less than adults aged 25–50. At the same time, the four focal countries all show pronounced old-age pressure, but with very different intensity: Japan combines very low fertility with extremely high public debt; the United States combines below-replacement fertility, large debt, and steep age-wealth gradients; Germany combines low fertility with a politically powerful older electorate but has also built in some sustainability adjustments; Israel is the major outlier, with 2.87 births per woman in 2024 and OECD evidence that young people are not less likely to vote than mid-life adults. \[2\]
On distributional facts, the age gradient is large where high-quality microdata exist. In the United States, the 2022 Survey of Consumer Finances shows median net worth of $39,000 for households with a reference person under 35 versus $409,900 for ages 65–74; mean net worth was $183,500 versus $1.79 million. In Germany, Bundesbank age profiles show the same life-cycle pattern: households with a reference person under 25 had median wealth of €11,400, while median wealth for ages 45–74 ranged between €154,700 and €231,000. These are not by themselves proof of exploitation, but they do define the political economy terrain on which intergenerational redistribution occurs. \[3\]
The report’s bottom-line judgment is therefore mixed but clear. The “generational warfare” thesis is analytically defensible as a recurrent tendency, not as a universal law. It is strongest in low-fertility democracies with pay-as-you-go pensions, debt-financed promises, high home-price politics, and turnout advantages for older cohorts. It weakens when a country has unusually high fertility, strong migration inflows, automatic pension stabilizers, or institutions that keep housing supply elastic and liabilities explicit. Israel is the main outlier among the required cases; Germany is a partial escape through reform; the United States and Japan fit the thesis much more strongly. \[4\]
Scope, assumptions, and formalization Link to heading
Unless otherwise specified, this report treats 1990–2025 as the default analytical window, but uses the latest available official series when the data are not annual or not yet fully harmonized across countries. “Public debt” refers to general government gross debt as a share of GDP in the IMF DataMapper. “Pension replacement rate” refers to the future gross replacement rate for an average-wage worker from OECD Pensions at a Glance 2023 country notes. “Fertility” is the latest official or OECD-harmonized total fertility rate. “Immigration” is reported here as World Bank net migration where comparable OECD inflow rates were not retrieved in machine-readable form. The OECD defines the housing price-to-income ratio as nominal house prices divided by disposable income per head, indexed to 2015 = 100. \[5\]
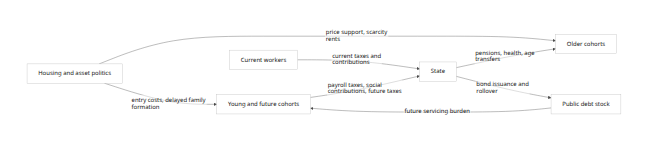
A rigorous way to formalize the thesis is to treat policy as the outcome of an age-weighted political choice rule. Let the effective political weight of age group $a$ at time $t$ be $w_{a,t} = population_{a,t} \times turnout_{a,t} \times responsiveness_{a,t}$. Let net transfers to that age group be $NTR_{a,t} = cash\ benefits + asset\ gains + regulatory\ rents - taxes - contribution\ burden - inflation\ tax$. A system exhibits intergenerational extraction when high-weight present cohorts can repeatedly choose policies with positive current net transfers to themselves while shifting part of the financing cost to lower-weight younger cohorts or future cohorts through debt, unfunded liabilities, or slower productivity and household-formation growth. The OECD evidence on turnout gaps and the architecture of pay-as-you-go pension systems make that mechanism more than hypothetical. \[6\]
In practice, the mechanism usually runs through five channels. First, pay-as-you-go pensions convert demographic aging into a tax-base problem because current workers finance current retirees. Second, public debt lets current electorates consume before paying. Third, housing and land-use politics can preserve the balance sheets of incumbent owners while pricing out younger households; official affordability indicators use price-to-income ratios precisely because that burden links asset politics to family formation and labor mobility. Fourth, monetary and macro-financial policy can protect the value of debt and incumbent assets, especially where the political system is highly sensitive to house prices and pension promises. Fifth, turnout asymmetry increases the leverage of older cohorts over all of the above. \[7\]
That mechanism does not imply that all transfers to older people are unjust or inefficient. Public pensions also insure against longevity, disability, and survivor risk. Japan’s official pension portal explicitly notes that the system is not only for old age; younger people can receive disability or survivors’ pensions as well. Likewise, the Bundesbank shows that measured wealth inequality in Germany looks materially smaller once one capitalizes statutory pension entitlements; in a rough simulation, the Gini for net wealth falls from about 72% to around 58%, and the wealth share of the top decile falls from roughly 54% to 39%. Those are important counterweights to any too-simple “the old are simply looting the young” story. \[8\]
Cross-national mechanisms and evidence Link to heading
The demographic side of the story is straightforward. OECD Family Database data updated in April 2026 report that in 2024 all OECD countries except Israel were below the replacement benchmark of roughly 2.1 children per woman; Israel stood at 2.87, the highest in the OECD. The same OECD material emphasizes that the long-run decline in fertility has been broad and sustained across the advanced democracies. That matters because under pay-as-you-go finance, low fertility shrinks the future base of contributors while leaving legacy promises in place. \[9\]
The political side is equally important. In Society at a Glance 2024, the OECD reports that across member countries young people aged 18–24 vote about 12 percentage points less than adults aged 25–50 on average, and that only Australia, Belgium, and Israel are exceptions where younger voters are more likely to vote than the 25–50 benchmark. That finding is central to a formal generational-conflict thesis because it converts age structure into effective electoral structure. Even before one counts lobbying, party organization, or policy salience, many democracies are not age-neutral electorally. \[10\]
The fiscal side varies sharply across countries. According to the IMF’s latest country profile pages in April 2026, general government gross debt stood at 125.8% of GDP in the United States, 204.4% in Japan, 64.6% in Germany, and 69.8% in Israel. Debt is not identical to intergenerational redistribution, but high debt makes it easier for today’s electorate to defer financing choices. It is therefore one of the main empirical channels through which present voters can externalize cost onto future taxpayers. \[11\]
The pension-finance channel is also visible. The United States’ Social Security system is financed by dedicated payroll taxes, with the SSA noting a 12.4% combined OASDI tax rate and an earnings cap of $176,100 in 2025. Germany’s Ageing Report country fiche shows public pension contributions at 9.9% of GDP in the baseline year and a public pension balance of about -0.3% of GDP in 2025. OECD country notes report future gross replacement rates for average earners of 39.1% in the United States, 49.4% in Japan, 43.9% in Germany, and 77.8% in Israel. The mix differs, but the basic political economy is common: pension promises are visible, concentrated, and salient; the tax and contribution burden is diffuse and often pushed forward. \[12\]
The household-balance-sheet side strengthens the argument further. In the United States, the Federal Reserve’s 2022 SCF shows a dramatic life-cycle wealth gradient, while the same report’s housing box states that the median home was worth over 4.6 times median family income in 2022, exceeding the previous 2007 high. Germany’s Bundesbank reports the same life-cycle wealth pattern and continued concentration of wealth at the top; households in the wealthiest decile still held more than half of total net wealth in 2023. Official affordability indicators are explicitly constructed around price-to-income ratios because high house prices relative to income are a direct burden on new entrants. \[13\]
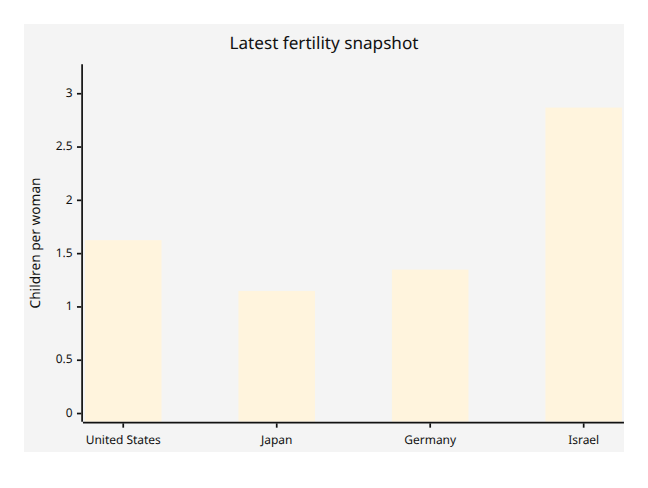
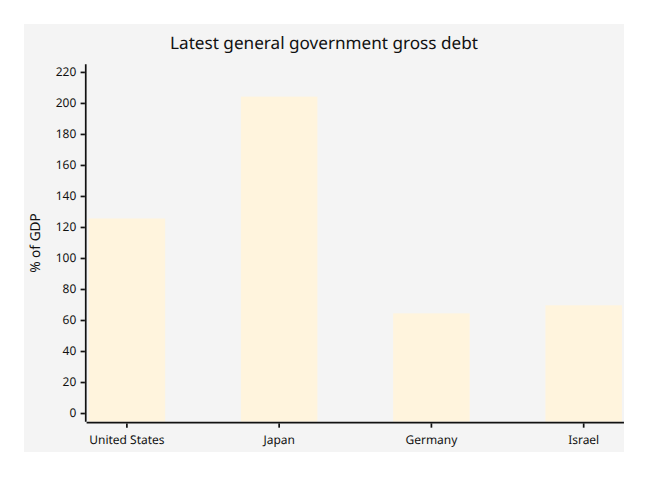
These charts are cross-sectional snapshots rather than full 1990–2025 panels, but they capture the central comparative fact pattern: the three low-fertility cases all sit well below replacement, while Japan and the United States also carry especially large public debt burdens; Israel is the fertility outlier and therefore the cleanest partial challenge to any claim of inevitability. \[14\]
Comparative snapshot of the four case-study countries Link to heading
| Metric | United States | Japan | Germany | Israel |
|---|---|---|---|---|
| Latest fertility rate | 1.6265 in 2024 | 1.15 in 2024 | 1.35 in 2024 | 2.87 in 2024 |
| General government gross debt | 125.8% of GDP | 204.4% of GDP | 64.6% of GDP | 69.8% of GDP |
| Future gross pension replacement rate, average earner | 39.1% | 49.4% | 43.9% | 77.8% |
| Age-wealth profile | Median net worth: <$35 = $39k; 65–74 = $409.9k | Comparable official age-wealth series not retrieved in accessible text form | Median wealth: under 25 = €11.4k; ages 45–74 = €154.7k–€231k | Comparable official age-wealth series not retrieved in accessible text form |
| Age-turnout profile | Older-higher pattern; harmonized latest country-specific official value not retrieved here | Youth turnout low; 2024 ministry-based reporting put turnout at 39.43% for teens and 34.62% for people in their 20s | 2021 Bundestag: turnout 76.6% overall; 50–59 reached 80.2%; 60+ made up 39% of voters | OECD/CSES: young people are an exception and are more likely to vote than adults 25–50 |
| Housing affordability metric | Median home value was over 4.6× median family income in 2022 | OECD harmonized price-to-income series exists, but exact latest text value not retrieved here | OECD harmonized price-to-income series exists, but exact latest text value not retrieved here | OECD harmonized price-to-income series exists, but exact latest text value not retrieved here |
| Immigration metric used here | Net migration 1,230,663 in 2025 | Net migration 140,579 in 2025 | Net migration -334,072 in 2025 | Net migration 11,466 in 2025 |
Notes: Fertility uses the latest official or OECD-harmonized TFR. Debt uses IMF DataMapper country profiles. Pension replacement rates are OECD future gross replacement rates for an average earner. U.S. housing affordability uses the Federal Reserve SCF housing box; for the other three countries, the OECD housing-price-to-income index is the preferred harmonized official series, but exact latest values were not retrievable in text view during this session. Immigration is World Bank net migration, which is comparable as a direction-and-scale measure but not identical to OECD permanent inflow rates. \[15\]
Country case studies Link to heading
United States
The United States is one of the clearest examples of the thesis because the core mechanism is institutionally transparent. Social Security is financed by dedicated payroll taxes, and the OECD country profile describes the public pension as a progressive public benefit with a future gross replacement rate of 39.1% for an average earner; the same OECD note reports public pension spending at 7.1% of GDP. Meanwhile, the IMF reports debt at 125.8% of GDP, and the CDC’s provisional 2024 vital statistics put the U.S. total fertility rate at 1.6265, still below replacement. That combination means a shrinking contributor base relative to promises, financed partly through payroll taxation and partly through broader fiscal stress. \[16\]
The intergenerational balance-sheet gradient is also unusually steep. The Federal Reserve’s 2022 SCF shows median net worth of $39,000 for households under 35, $135,600 for ages 35–44, $247,200 for ages 45–54, $364,500 for ages 55–64, and $409,900 for ages 65–74; the corresponding means ranged from $183,500 under 35 to $1.79 million for ages 65–74. That is a roughly 10.5× median gap and about a 9.8× mean gap between under-35 households and 65–74 households. The same SCF report also found that the median home was worth over 4.6 times median family income in 2022. On a generational-war reading, those are precisely the conditions under which incumbent owners and benefit recipients can become a highly protected coalition while new entrants face both high payroll deductions and high asset-entry costs. \[17\]
Japan
Japan is the strongest demographic-pressure case in the set. The Ministry of Health, Labour and Welfare reports a 2024 total fertility rate of 1.15, a new record low, while the IMF country profile puts general government gross debt at 204.4% of GDP, by far the highest among the four countries reviewed here. The OECD country note reports a future gross pension replacement rate of 49.4% for an average earner. Japan is therefore the cleanest example of a polity where very low fertility and very high inherited liabilities sharply raise the probability of intergenerational redistribution conflict. \[18\]
The political channel is also visible. Japan’s pension portal stresses that the system covers all residents aged 20–59 in the National Pension and employees in the Employees’ Pension Insurance, making broad inter-cohort financing unavoidable. Comparative evidence from the OECD shows that Japan follows the standard pattern in which young people vote less than prime-age adults, and Japanese reporting based on the 2024 lower-house election put turnout at 39.43% for teenagers and 34.62% for people in their 20s. That is exactly the kind of participation skew that allows current retirees and near-retirees to become the decisive bloc in a low-fertility PAYG system. \[19\]
Germany
Germany is analytically important because it combines clear gerontocratic pressure with partial institutional correction. Destatis reports a 2024 fertility rate of 1.35. The IMF reports gross debt at 64.6% of GDP, well below the United States and Japan, but Germany’s pension system still shows significant demographic stress. The European Commission’s Germany ageing fiche reports public pension contributions of 9.9% of GDP and a public pension balance of about -0.3% of GDP in 2025. The OECD country note says the future gross replacement rate for an average earner is 43.9%, reflecting Germany’s sustainability factor and prior reform path. Germany therefore shows that even without extreme debt, aging can create a strong intergenerational distributional struggle through contribution rates and federal subsidies. \[20\]
Germany’s age-wealth and age-turnout data strongly support the political-economy side of the thesis. Bundesbank material shows median wealth of only €11,400 for households with a reference person under 25, compared with €154,700 to €231,000 for ages 45–74. On the electoral side, the Federal Returning Officer reports that in the 2021 Bundestag election overall turnout was 76.6%, the 50–59 age group reached 80.2%, and 39% of voters were aged 60 or over. That combination — concentrated asset ownership, high older participation, and a large elderly voter share — is exactly the profile under which “present electorate extraction” becomes a serious analytical possibility. \[21\]
Israel
Israel is the most important counterexample in the required set. The OECD Family Database reports that Israel had a 2024 total fertility rate of 2.87, making it the only OECD country above replacement. In the OECD’s comparative voting chapter, Israel is also one of the very few countries where young people are more likely to vote than adults aged 25–50. Those two facts alone materially weaken the standard “democracy + welfare state + aging = gerontocracy” mechanism. Israel still has debt — the IMF reports 69.8% of GDP — and its old-age system is generous by OECD standards, with a future gross replacement rate of 77.8% for an average earner. But the demographic and turnout structure is far less tilted toward elder extraction than in the other three cases. \[22\]
At the same time, Israel is not a full falsification of the underlying thesis. The National Insurance Institute states that old-age insurance provides a regular monthly income in old age, with full entitlement at age 70 regardless of income, meaning the system remains politically salient and only partially means-tested before that point. Israel’s relative demographic youth and exceptional fertility give it more room to finance age-related commitments, but they do not eliminate intergenerational tension over housing, taxes, security burdens, or transfers between demographic subpopulations. So Israel should be read not as proof that democracy is innocent, but as proof that demography and participation structure matter at least as much as regime type. \[23\]
Counterexamples and escape conditions Link to heading
The first escape condition is demographic renewal. A democracy with high fertility or strong net in-migration does not face the same arithmetic as one with ultra-low fertility. That is why Israel matters so much analytically: it shows that liberal-democratic or electoral institutions do not mechanically produce sub-replacement fertility or a unique elderly veto. The OECD evidence is explicit that Israel is the lone above-replacement OECD case in 2024, and also one of the few cases without a youth turnout penalty relative to prime-age adults. \[24\]
The second escape condition is automatic stabilizers inside the pension system. Germany’s relatively low future gross replacement rate compared with Israel, plus the Ageing Report’s pension-balance projections, are evidence of prior reform efforts that shift some of the burden away from younger contributors. This does not remove the generational conflict; it changes its form from “ever-rising promises” to “who absorbs the adjustment.” Still, such mechanisms weaken the pure extraction thesis because they reduce the scope for current voters to preserve benefits indefinitely without visible tradeoffs. \[25\]
The third escape condition is accounting honestly for implicit public pension wealth. The Bundesbank result is important here: once statutory pension entitlements are capitalized, Germany’s measured wealth inequality falls sharply. That means some of what looks like “the old own everything” in standard net-worth statistics is partly a measurement artifact created by excluding illiquid pension claims. This does not rescue debt-financed or turnout-skewed systems, but it does mean that headline wealth tables can overstate the degree of pure asset extraction if public pension rights are ignored. \[26\]
The fourth escape condition is broad political participation by younger cohorts. The OECD’s average 12-point youth turnout deficit is not destiny; it is a contingent institutional fact. If younger cohorts vote at rates closer to older citizens, the effective political weight $w_{a,t}$ in the formal model changes immediately. Israel’s exception status on youth turnout is therefore not a curiosity; it is a direct challenge to the “inevitability” claim. \[10\]
Policy options, feasibility, and risks Link to heading
A serious policy response has to target the mechanisms rather than the rhetoric. The first set of policies concerns pensions: indexing retirement ages to longevity, slowing benefit growth for higher earners, strengthening means-tested top-ups instead of universal generosity at the top, and expanding prefunded or notional-funded pillars. These measures reduce the degree to which current retirees can transfer costs forward. The major political obstacle is obvious from the evidence: older cohorts vote more, own more, and are easier to organize around preserving visible benefits than younger cohorts are around defending diffuse future tax capacity. \[27\]
The second set concerns housing supply and asset-price politics. Official housing-affordability metrics use price-to-income ratios because high entry prices depress household formation, mobility, and wealth accumulation for younger cohorts. In the United States, the Federal Reserve’s SCF already shows a median home-value-to-income ratio above 4.6 in 2022. Policies that make new supply easier — land-use liberalization, faster permitting, infrastructure that opens new housing locations, and tax systems less dependent on scarcity rents — are among the clearest ways to reduce generational conflict without directly cutting earned entitlements. The risk is that incumbent homeowners are often the most intense local political participants. \[28\]
The third set concerns migration and labor supply. Migration can raise the contributor base and temporarily relieve pension arithmetic; the World Bank’s 2025 net-migration figures show how large the differences can be, from 1.23 million in the United States to 140,579 in Japan, while Germany was negative in the retrieved 2025 World Bank series. But migration is not a free lunch. If housing supply remains constrained, the demographic fix can intensify the asset-price problem. In political terms, migration is easiest to sustain where voters believe it raises output faster than it raises congestion and rent. \[29\]
The fourth set is productivity and growth. A richer worker can support more retirees than a poorer worker. That sounds banal, but for intergenerational conflict it is decisive: a society can soften age conflict either by changing who gets what, or by enlarging the pie. The problem is that productivity policy is politically harder because its gains are delayed, uncertain, and less legible than straightforward transfer promises. So there is a chronic democratic bias toward visible distributive politics over long-horizon growth policy, especially when current electorates are older and future cohorts are underrepresented. This is an inference from the turnout, debt, and entitlement evidence rather than a single-country empirical claim. \[30\]
Taken together, the most realistic reform package is a portfolio: moderate pension means-testing or benefit-slope flattening at the top; automatic retirement-age and sustainability adjustments; aggressive housing-supply reform; selective migration calibrated to absorptive capacity; and growth-oriented reforms that raise long-run wages. The central risk is transition politics. Any shift from pay-as-you-go to more funding imposes a “double burden” on a transition cohort, and any housing reform threatens existing balance sheets. That is why reform is usually easier before the electorate becomes very old, not after. \[31\]
Open questions and limitations Link to heading
Two limitations matter. First, some requested metrics — especially latest harmonized housing-affordability index values and age-specific net-worth series for Japan and Israel — were not retrievable in machine-readable official text during this session, even though the underlying official databases exist. Those cells are therefore marked cautiously rather than filled from weaker unofficial sources.
Second, the report establishes a strong descriptive political-economy pattern, not a universal causal law. “Liberal democracy” alone does not explain the outcomes. The better explanatory bundle is demography + turnout structure + pension design + debt capacity + asset politics. That bundle fits the United States and Japan strongly, Germany moderately, and Israel only partially.
Selected source links Link to heading
The OECD Family Database fertility series is the key cross-country demographic source. \[9\]
The OECD Society at a Glance 2024 voting chapter is the key cross-country source on youth turnout gaps. \[10\]
IMF DataMapper country profiles provide the latest general government gross debt values used here for the United States, Japan, Germany, and Israel. \[32\]
For the United States, the main official sources are the CDC provisional 2024 birth report, the Federal Reserve’s 2022 SCF report, the SSA/OECD pension documentation, and the OECD country note on pensions. \[33\]
For Japan, the main official sources are the Ministry of Health, Labour and Welfare 2024 vital statistics releases, the official pension portal, and the OECD country pension note. \[34\]
For Germany, the main official sources are Destatis on births, the Bundesbank household wealth publications, the Federal Returning Officer’s representative electoral statistics, the OECD pension note, and the European Commission ageing fiche. \[35\]
For Israel, the main official sources are the OECD Family Database fertility update, the IMF country profile, the OECD voting comparison, the OECD pension note, and the National Insurance Institute’s old-age insurance page. \[36\]
For migration, the World Bank net-migration indicator and country pages are the comparable source used for all four countries. \[37\]
\[1\] \[6\] \[10\] \[27\] \[30\] \[31\] https://www.oecd.org/en/publications/society-at-a-glance-2024_918d8db3-en/full-report/voting_4cc36656.html
\[2\] \[4\] \[9\] \[22\] \[24\] \[36\] https://webfs.oecd.org/els-com/Family_Database/SF_2_1_Fertility_rates.pdf
https://webfs.oecd.org/els-com/Family_Database/SF_2_1_Fertility_rates.pdf
\[3\] \[13\] \[17\] \[28\] https://www.federalreserve.gov/publications/files/scf23.pdf
https://www.federalreserve.gov/publications/files/scf23.pdf
\[5\] https://www.imf.org/external/datamapper/GGXWDG_NGDP%40WEO/OEMDC/ADVEC/WEOWORLD
https://www.imf.org/external/datamapper/GGXWDG_NGDP%40WEO/OEMDC/ADVEC/WEOWORLD
\[7\] \[12\] \[16\] https://www.ssa.gov/oact/TRSUM/index.html
https://www.ssa.gov/oact/TRSUM/index.html
\[8\] \[19\] https://www.nenkin.go.jp/international/english/index.html
https://www.nenkin.go.jp/international/english/index.html
\[11\] https://www.imf.org/external/datamapper/profile/JPN
https://www.imf.org/external/datamapper/profile/JPN
\[14\] \[15\] \[33\] https://www.cdc.gov/nchs/data/vsrr/vsrr038.pdf
https://www.cdc.gov/nchs/data/vsrr/vsrr038.pdf
\[18\] \[34\] https://www.mhlw.go.jp/toukei/saikin/hw/jinkou/geppo/nengai24/dl/gaikyouR6.pdf
https://www.mhlw.go.jp/toukei/saikin/hw/jinkou/geppo/nengai24/dl/gaikyouR6.pdf
\[20\] \[35\] Births - German Federal Statistical Office
\[21\] https://www.bundesbank.de/en/tasks/topics/monthly-report-wealth-in-germany-up-significantly-908262
https://www.bundesbank.de/en/tasks/topics/monthly-report-wealth-in-germany-up-significantly-908262
\[23\] https://www.btl.gov.il/English%20Homepage/Benefits/Old%20Age%20Insurance/Pages/default.aspx
https://www.btl.gov.il/English%20Homepage/Benefits/Old%20Age%20Insurance/Pages/default.aspx
\[25\] https://economy-finance.ec.europa.eu/document/download/e8f41d38-6d27-45b4-8919-c9348720fcfc_en?filename=2024-ageing-report-country-fiche-Germany.pdf
\[26\] https://publikationen.bundesbank.de/publikationen-en/reports-studies/monthly-reports/monthly-report-april-2025-954672?article=household-wealth-and-finances-in-germany-results-of-the-2023-household-wealth-survey-954660
\[29\] https://data.worldbank.org/country/united-states
https://data.worldbank.org/country/united-states
\[32\] https://www.imf.org/external/datamapper/profile/USA
https://www.imf.org/external/datamapper/profile/USA